 You’ve probably heard of the “4% rule” when withdrawing income from a retirement portfolio. I think using such a rule is fine when you are early in the accumulation phase, although I like the “3% rule” better for early (long) retirements. But heck, reach 25x expenses first and then reassess. However, when it’s actually time to spend down that money, the execution can be tricky. If you start out taking 4% on a $1,000,000 portfolio ($40,000) and then the market drops 50%, will you really take $40,000 (8%) out of your sub-$500,000 portfolio the next year?
Being flexible in your withdrawals works better with both theoretical backtests and natural tendencies. If my portfolio drops 50%, I’m going to tighten the belt and spend less money the next year. Some people may not want to admit this, but I would consider taking on a part-time job again in a severe event. I collect part-time job ideas as part of this Plan B.
On the flip side, if you’ve used a lot of portfolio simulators like and , you’ll notice that your portfolio sometimes gets crazy huge. If your portfolio doubles in size, you might decide to live it up a bit and spend more than 4% of your original amount (inflation-adjusted).
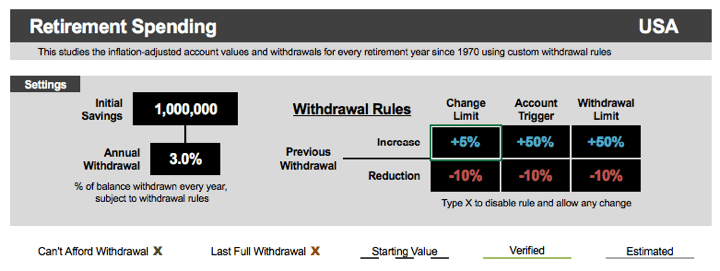
Accordingly, I was impressed to see that their already-useful to account for flexible portfolio withdrawals. Everything has been elegantly simplified into four variables:
Withdrawal Rate: the percentage of the portfolio you withdraw every year to fund your retirement expenses
Change Limit: The maximum amount that a withdrawal can increase or decrease from year to year
Account Trigger: A simple rule for when you’re allowed to increase or decrease spending based on how the portfolio is doing relative to its original value
Withdrawal Limit: The minimum or maximum withdrawal you realistically need to pay the bills and live a happy life regardless of what a flexible spending strategy might recommend
Keep in mind that the spending is already inflation-adjusted, i.e. it increases each year with inflation even with no change. Here’s a screenshot:
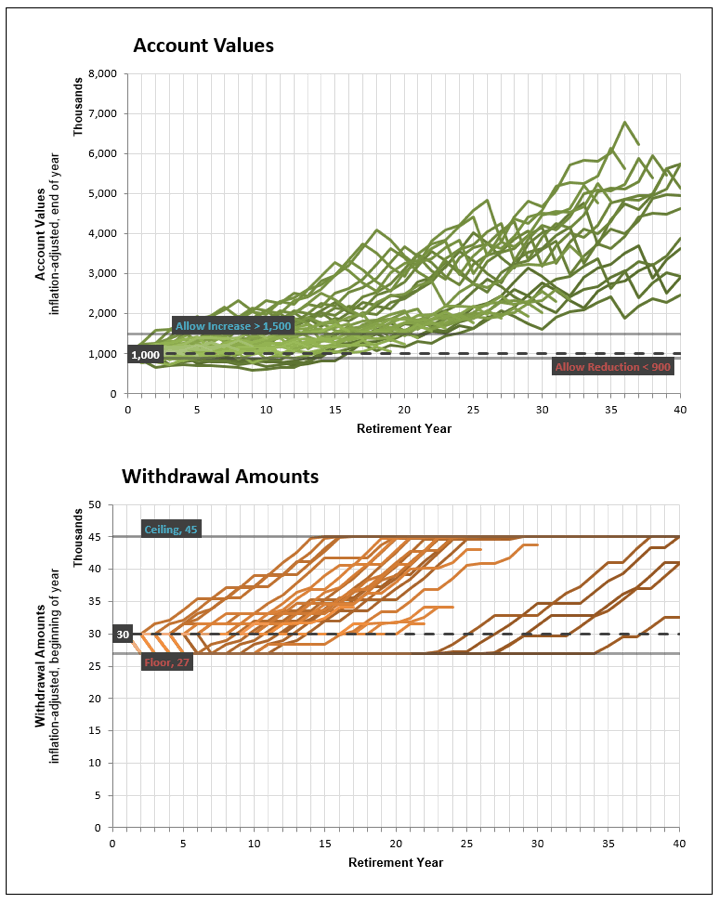
Take some time to play around with the many combinations. You could see what happens if you let the withdrawals vary wildly. You could see what happens if you only allow the withdrawal amount vary within a tight range. How does your portfolio balance change? For example, I thought about starting with a relatively conservative number like 3% base withdrawal rate, but also be willing to drop it to 2.7% (10% less) if the portfolio drops by 10% in value. Meanwhile, I’d wait until the portfolio increases by 50% before I start paying cash to fly business class everywhere (#goals).
If I were to have a wish list for a new feature, I would like it to show me the minimum balance that the portfolio reached during any of the scenarios. This would let me know the maximum drawdown experienced using my set of variables, as the chart is a little hard to read.
“The editorial content here is not provided by any of the companies mentioned, and has not been reviewed, approved or otherwise endorsed by any of these entities. Opinions expressed here are the author’s alone. This email may contain links through which we are compensated when you click on or are approved for offers.”
from .
Copyright © 2019 MyMoneyBlog.com. All Rights Reserved. Do not re-syndicate without permission.